
Market Research Technique: Conjoint Analysis
There are a variety of qualitative and quantitative research tools that can be used to help businesses understand how best to design and optimize the experiences they are delivering to their customers for customer value and time well spent. Today we will dive into one of our favorite quantitative methods - conjoint analysis.
Conjoint analysis is a market research technique for measuring the preference and importance that respondents (customers) place on the various elements of a product or service. It can play a critical role in understanding the trade-offs that people would make when given different product options and different product configurations. It is typically conducted via online questionnaires where respondents will be shown varying bundles and asked to evaluate and select those bundles based on which they would be most likely to purchase (if any) or which is the most appealing to them. As participants make choices, certain features and feature combinations show up more frequently, while other features and feature combinations show up less frequently. These selections inform which bundles are likely to succeed and which ones are less likely to be chosen if offered. This idea of features either increasing or decreasing the likelihood that a product package is interesting to a buyer and then trying to predictively model the level of likelihood to purchase is the essence of conjoint analysis.
Simply, conjoint analysis is a research method for discerning how people choose. It pinpoints the key elements that dictate and control those decisions. These studies yield models for predicting choice behavior.
To further explore the idea of how conjoint analysis can be utilized to improve experiences, we will consider a customer experience dilemma of a made-up amusement park. FunLand has been around for 50 years, but attendance and revenue have been slipping over the past couple of years. They have less customers showing up at the park. Customers that do show up aren’t having a good experience and are not likely to visit the park again. FunLand isn’t sure if it is their rides and amusements that are causing these unsatisfactory trips to the park or if it is the service they are receiving. Or maybe it is both? Word of these poor experiences is getting out and hurting their brand. Lastly, their employees are not happy. It is obvious that they are unengaged and uninterested, and they know this is affecting the customer experience.
FunLand has some crucial questions they need to answer as changes must be made to stay relevant. They feel the opportunity is there, but they will need to reinvent themselves in order to capture it, but they will need to make changes quickly before it is too late.
Improving the Customer Experience
FunLand wants to be known for delivering an incredible customer experience, but right now, that is not the case. As part of the customer interviews that have been conducted, a frequently mentioned frustration has been the wait times while waiting to ride. An easy solution would be to increase the number of rides and attractions at FunLand. But unfortunately, the resources to make that happen are prohibitive. They need to find a scrappier approach rather than add another multimillion-dollar attraction. What can they incorporate in the lines to reduce the frustration?
Problem: FunLand is not delivering a great customer experience, and a big factor is the wait times for the rides. They will not be able to add more attractions though to further disburse riders.
Objective: Find experiences and entertainment that can be introduced as part of the long lines for the rides.
Hypothesis: If FunLand adds the right experiences to the line, we can reduce the time wasted that customers are currently complaining about.
Here are the conjoint attributes that will be included in this customer experience conjoint study:
Wait time
15 minutes
30 minutes
1 hour
1.5 hours
Experience
Food and drink samples
Arcade games
High-speed wifi
None
Entertainment
TV’s showing sports, news, and music videos
Song and dance live performers
Meet and greet mascots and characters
As part of this conjoint study, it will be important to include a ‘None’ option as it represents a customer avoiding the line altogether. This will be key in serving as a baseline and in answering the question of ‘is this line experience appealing enough for customers to wait?’.

Figure 1.1: Conjoint task for understanding the customer experience
The survey was sent to the general population as well as those in a customer database to get an additional read on those familiar with the rides at FunLand.
The analyst first wanted to do some checks to ensure people understood the conjoint exercise. They did this by examining the relative preference for the line wait times. This matches what they would have expected; longer wait times equal less preference.

Figure 1.2: Charting the relative utility of wait times
Next, they wanted to measure the likelihood of someone choosing an average package at the different wait times versus avoiding the line altogether (none option). The chart below checks out that respondents understood the exercise as we see the expected ride selection likelihood seriously drop as wait time increases.

Figure 1.3: Showcasing the likelihood that someone would stay in line (all else remaining equal) as wait time increases
In furthering their analysis, FunLand wants to see how much the wait time impacted decisions in comparison to the Experience and Entertainment features. To no surprise, Wait Time factored in more than the other features in the decisions the respondents were making.

Figure 1.4: Glimpse at the importance of the different features
There is an opportunity, however, with the right combination of Experience and Entertainment to offset longer times. FunLand wants to further look into those combinations to see where customers skipping out on rides can be minimized. They crank up the simulator to identify what can be done.

Figure 1.5: Simulating packaging including short wait time vs long wait times
Initially, they looked at if providing high-speed internet to those in lines would make up for long wait times. The simulator clearly shows that isn’t enough. But what if they can provide food samples and drinks? They like this idea because it can also introduce patrons to new food/drink options. They look to the simulator to understand what that can deliver.

Figure 1.6: Simulating what can be done to offset long wait times
It doesn’t become more favorable to the 15-minute wait time option but it does get pretty close which is a win in FunLand’s book.
Next, they look at how this option would fare against skipping the lines altogether.
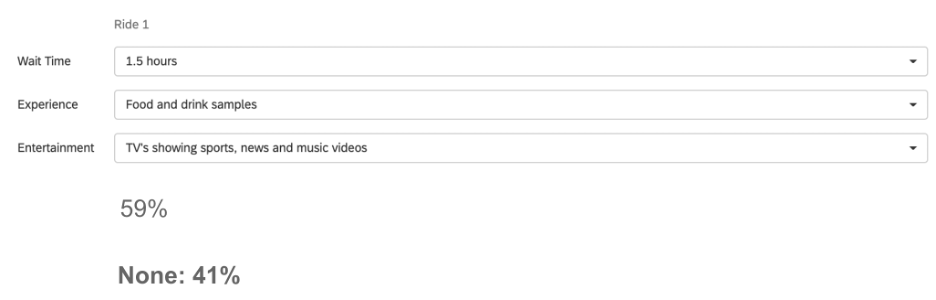
Figure 1.7: Simulating what the improved package would look like vs avoiding the line altogether (None)
FunLand is really excited about this option because a 1.5 hour wait with no ‘experience’ had a 7% likelihood to be selected (preference share) vs skipping out on the line. Without the ability to really shorten lines by adding new attractions, FunLand decides to start treating the customers with hors d’oeuvres as they await the roller coaster.
Conjoint Analysis has a variety of uses, including:
Understanding price sensitivity/elasticity
Determining optimal price points
Understanding customer value for features in new or existing products
Testing products against the market or competition
Determining brand positioning and value
Finding messaging strategies that resonate with customers
Configure different product offerings or loyalty programs
Evaluate willingness to pay for features and product configurations
Determine purchase intent
Measure which brand messages resonate the best with customers and target market
Optimize Employee Benefit bundles
Prioritize the features that should be included in products, programs, and services
Written by Craig Lutz, Quantitative Analytics Advisor to Stone Mantel